

KPIs to Measure Inventory Performance
Omega Software enables a business to efficiently manage and regulate its inventory levels to fulfill consumer demand and cut expenses. Having the proper quantity of inventory on hand to execute client orders while avoiding having too much inventory that can tie up cash and raise storage expenses is considered good inventory performance.

How to Assess the Performance of an Inventory?
KPIs such as inventory turnover ratio, carrying cost of inventory, stockout rate, order lead time, and gross margin return on investment can all be used to gauge the success of a list. Companies may optimize their inventory levels, cut expenses, and boost profitability by keeping an eye on these KPIs and maintaining customer happiness, preventing stockouts, reducing waste, and enhancing overall business efficiency.
Mentioned below are some KPIs for inventory performance:
- The Inventory Turnover Ratio
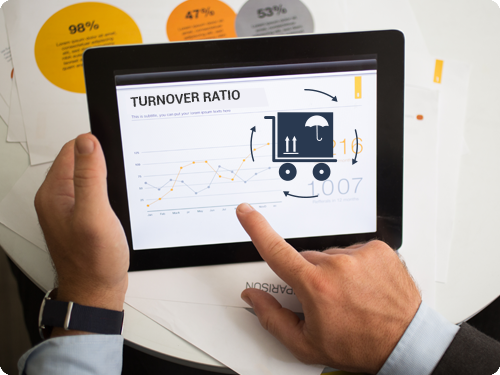 The inventory turnover ratio is a popular KPI in inventory management that gauges how effectively a business uses its inventory. It determines how frequently a company sells and replaces its shares during a given period.
The cost of products sold is divided by the average inventory value to determine the Inventory Turnover Ratio. A more significant proportion shows that a business is selling and refilling its stock more quickly, which is often regarded as an indication of effective inventory control.
Businesses can learn more about their inventory management procedures and spot areas for improvement by tracking the inventory turnover ratio. For instance, a poor inventory turnover ratio can mean that a business is stockpiling too much inventory or needs help moving its goods. A high inventory turnover ratio may indicate that a business is running out of stock or does not have enough inventory to meet demand. Ultimately, balancing keeping enough lists on hand to meet demand and cutting back on the expenses related to holding too much is essential.
- Stockout Rate
The percentage of time a product is unavailable to clients owing to an inventory shortage is tracked by the critical KPI known as the stockout rate. The total number of selling chances divided by the total number of stockouts is the formula for determining the stockout rate. A reduced stockout rate suggests better inventory management and planning since it shows how well a business can satisfy client demand while maintaining acceptable stock levels.
A high stockout rate can harm a firm in several ways, including lost sales, lowered customer satisfaction, and reputational harm. Businesses may see patterns and prevent stock outs by proactively managing their supply chains, modifying inventory levels, and improving forecasting accuracy by keeping an eye on the stockout rate.
Improving the stockout rate can positively impact a company’s financial line and lower the adverse effects of stockouts. Businesses can enhance sales income and customer loyalty while decreasing stockouts, ultimately resulting in higher profitability.

- Goods Carrying Costs
The costs of keeping and storing inventory are known as goods carrying costs. Typical expenditures associated with maintaining inventory in good condition include rent, utilities, insurance, labor, and other fees. The whole value of the stock is divided by the total carrying costs to determine the cost of goods taken.
Watching the goods Businesses should consider carrying costs since they can utilize them to find areas where they can cut costs and improve inventory management. A corporation that can sustain inventory levels while reducing associated costs is said to have excellent inventory management, and lower carrying costs indicate this.
Optimizing inventory levels is one method for cutting costs associated with moving goods. Higher carrying costs might occur from holding too much inventory because it takes more space and resources to store and maintain the list. On the other hand, an inventory shortage might result in lost sales and stockouts.
- Gross Margin Return on Capital
GMROI compares the gross margin generated by inventory to the amount invested in stock to calculate return on investment. The gross margin equals the average inventory investment divided by 100 to determine GMROI.
The gross margin is the discrepancy between the cost of goods sold and the sales revenue. The average inventory cost over a given time frame, such as a year, is the average inventory investment. As a higher GMROI shows a corporation is generating a higher gross margin than its investment in inventory, it also signals better inventory management and higher profitability.

Because it considers both the cost of inventory and the revenue from sales, GMROI is a helpful KPI for organizations. Companies can evaluate GMROI to find areas where better inventory management might increase profitability, such as lower inventory levels, higher sales, or better pricing methods.
- Order Lead Time
Order Lead Time is a KPI that gauges how long it takes to deliver inventory once an order has been placed. This KPI is computed as the total lead time, which considers how long it takes to process orders, ship packages, and receive them. A reduced lead time suggests better supply chain management and inventory planning.
Ordering Monitoring Lead time is crucial for businesses because it can assist in pinpointing areas where the supply chain needs to be improved and because it can help stop stock outs and other problems with inventory management. Companies can increase customer satisfaction and lower the chance of lost revenue due to product unavailability by cutting Lead times.
Businesses can employ various tactics to decrease order lead times, including inventory optimization, faster order processing and shipping, and close supplier collaboration to speed up delivery.
Conclusion
Any business must manage its inventory well to succeed. Omega Software offers tools to assist organizations in managing their inventory and controlling inventory levels to satisfy consumer demand and cut costs.
Businesses may manage their inventory levels, cut waste, and improve overall business efficiency by tracking key performance metrics such as inventory turnover ratio, stockout rate, product carrying costs, gross margin return on investment, and order lead time.
Additionally, businesses may maximize customer happiness, avoid stockouts, boost profitability, and maintain an edge over rivals by concentrating on these KPIs.